IRENA report highlights 16% decrease in geothermal power LCOE in 2024
 Global weighted-average LCOE of renewable power, 2023-2024 (source: IRENA)


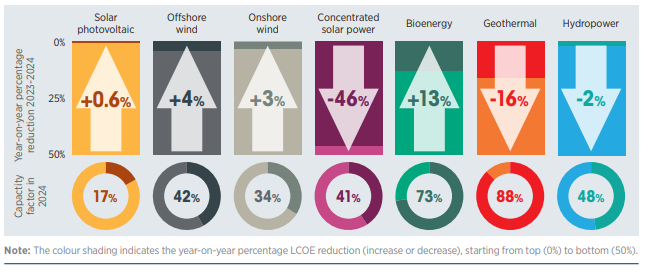
IRENA reports that the global weighted average LCOE for geothermal power decreased by 16% in 2024, signaling stability and opportunity for further growth.
The newly published “Renewable Power Generation Costs in 2024” document by the International Renewable Energy Agency (IRENA) reports that the global weighted average Levelized Cost of Electricity (LCOE) for geothermal power generation has dropped by 16%, from USD 0.072/kWh to 0.060/kWh. Although undoubtedly a positive development, this figures comes close to the 2022 value (USD 0.059/kWh) and is within the range of average LCOE values for the past 5 years (USD 0.059/kWh to USD 0.075/kWh)
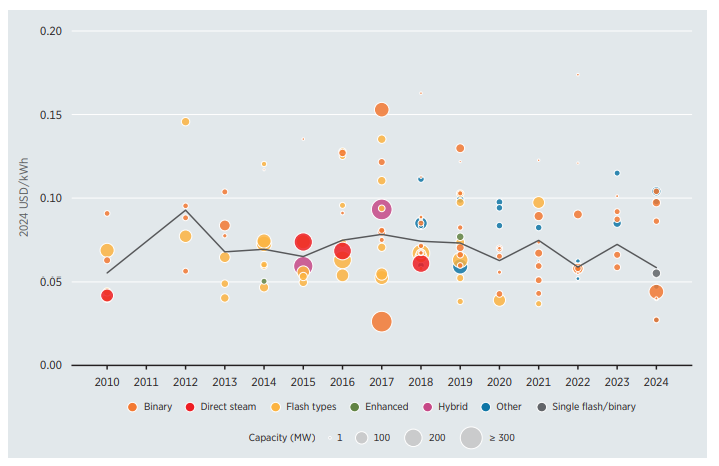
Compared to other renewables, geothermal power has a higher weighted average LCOE than hydropower (USD 0.057/kWh), solar PV (USD 0.043/kWh), and onshore wind (USD 0.034/kWh). However, LCOE values for concentrated solar power (CSP) (USD 0.092/kWh), bioenergy (USD 0.087/kWh), and offshore wind (USD 0.079/kWh) are still higher than geothermal.
Low deployment rate translates to fluctuating year-on-year values
As we had reported at the start of the year, the global geothermal power installed capacity as of the end of 2024 stands at 16,873 MWe. New capacity addition for the year totaled 389 MWe, with the Tauhara II power plant in New Zealand representing the largest single addition at 174 MWe. (Editor’s note: Our installed capacity values are different from those of the IRENA report. See our previous notes on why such discrepancies exist.)
For the year 2024, LCOE values ranged from a high of USD 0.090 kWh (Indonesia) to as low as USD 0.033/kWh (Türkiye). The drop in the global weighted average LCOE was heavily influenced by the Tauhara II project, primarily driven by a lower Total Installed Cost for geothermal power in New Zealand.
Given the unique nature of geothermal systems across different markets and geologies, geothermal power does not have the same standardized cost structures as that of onshore wind or solar PV. Geothermal power project costs are heavily influenced by reservoir quality, directly determining costs associated with drilling (including depth and number of wells) and power plant technology. Geothermal projects also have a very different risk profile, as the resource quality cannot be determined unless capital-intensive drilling has been done.
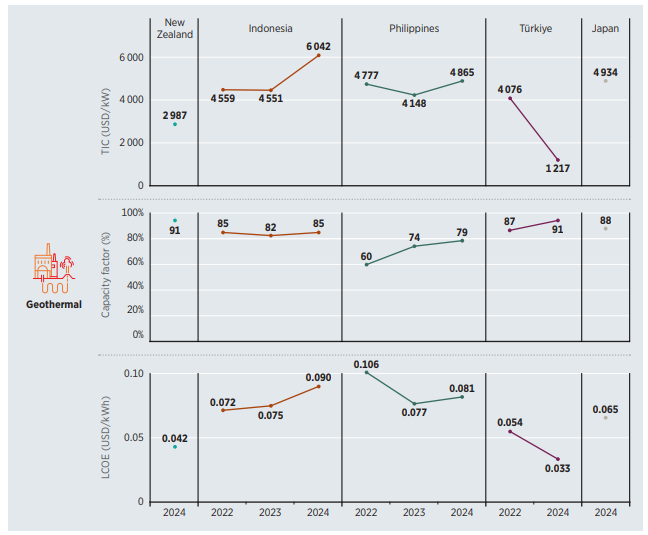
The figure above succinctly shows this trend, with different regions having markedly different LCOE and TIC values for geothermal power. Capital costs for Indonesia were significantly higher than other regions, likely brought about by large-scale drilling and exploration campaigns. The drop for Türkiye was also significant, but currency exchange rate trends must be factored in analyzing this trend, particularly when all figures are expressed as USD.
LCOE trends closely follow the TIC trends. However, O&M costs for geothermal can also be high because of make-up drilling, especially when the goal is to maintain high Capacity Factors (CF). The O&M cost assumption applied for projects commissioned in 2024 was USD 125/kW per year and USD 110/kW per year for projects deployed between 2010 and 2023.
TIC and LCOE trends tend to fluctuate heavily year-to-year owing to the small number of geothermal power facilities that go online on any single year. This can make analysis of global trends complicated and potentially misleading. Thus, the situation warrants a closer look at local and regional factors that influence development costs.
Capacity factor remains geothermal power’s strength
At an average of 88% for the year 2024, a high capacity factor remains one of the greatest strengths of geothermal over other forms of renewable power. This figure also went up by 7% from 2023.
Average CFs for geothermal power have remained competitive since 2010, with values ranging from 77% to 88%. Compared to other renewables, geothermal power facilities are designed to operate most of the year and are not influenced by weather conditions or day-night cycles. There are still some variations in CF from one region to another due to resource quality, reservoir dynamics, and economic factors.
Technological trends provide optimism
The emergence of so-called “next-generation” technologies is giving plenty of optimism for geothermal power to grow beyond its current scope. Enhanced Geothermal Systems (EGS) and Advanced Geothermal Systems (AGS) are striving to make geothermal power development possible in areas and regions previously not considered viable under the conventional geothermal method. Superhot geothermal seeks to increase the productivity of geothermal wells by tapping into much hotter resources. Such pioneering methods have also served as testing grounds for work to reduce drilling costs and improve stimulation methods.
There are also efforts to pair geothermal with other renewables, potentially acting as energy storage for intermittent renewable energy sources like solar and wind.
The geothermal industry continues to await the commercial-scale deployment of these next-generation technologies, with Fervo Energy and Eavor Technologies as some of the companies leading the way. Continued innovation and government support remain key factors to realizing the potential of such technologies.
A breakthrough year for renewable power as a whole
Overall, 2024 was a breakthrough year for renewable with an unprecedented 582 GW of new capacity addition. Solar PV contributed greatly to this surge, accounting for 77.8% of the total new capacity. On a per-country basis, China accounted for 61.2% of global solar PV additions and 69.4% of new wind installations.
Although the total installed renewable power capacity reached 4,442 GW in 2024, this is still far from the target of 11,000+ GW by 2030 which was agreed upon at COP28. The growth of geothermal power has remained near-constant in 2024. Work being done in emerging markets (such as the Caribbean and Canary Islands), continued growth in the Pacific and East African regions, and technological innovations (including superhot geothermal and deep drilling technologies) are paving the way for exponential growth in the coming years.


